View function statistics
This article provides instructions for viewing throttling information for data transformation functions and execution statistics for all function types.
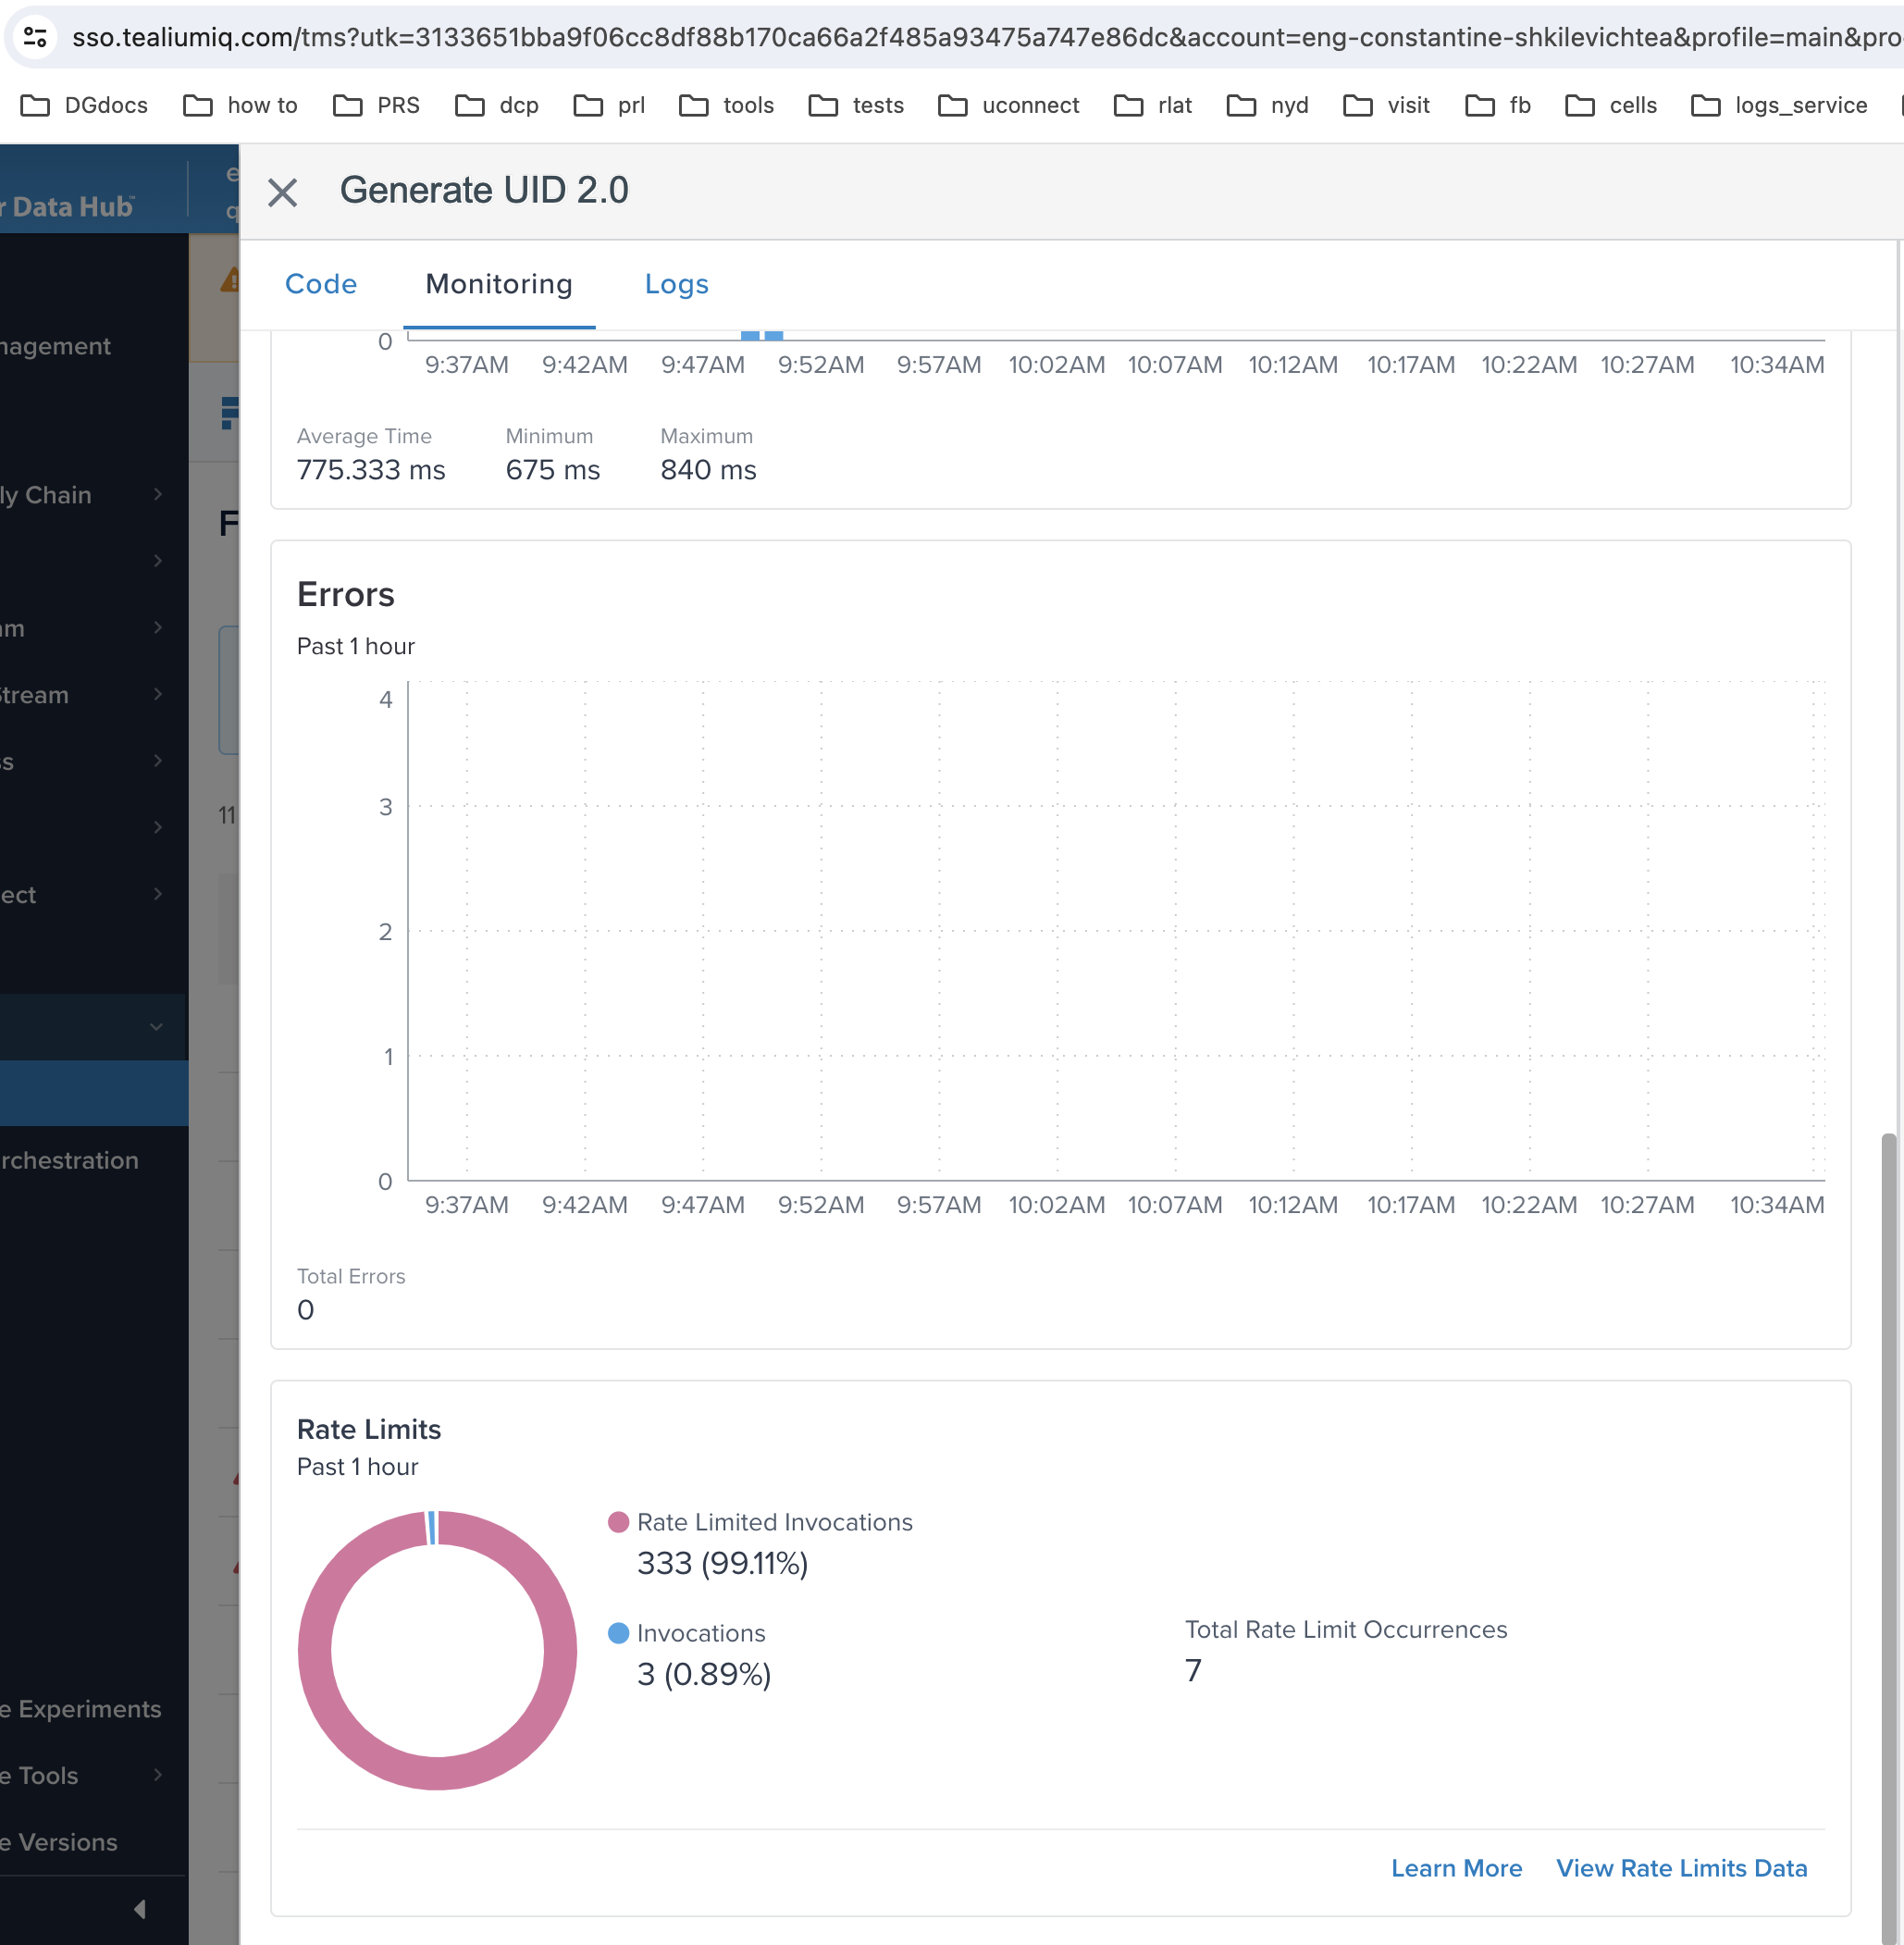
The Monitoring tab in the code editor displays execution statistics for all function types. You can also see more detailed information about throttled data transformation functions.
View throttling information for a data transformation function
To view information for a throttled function, follow these steps:
- In the Functions Overview, click on a throttled function, then click the Monitoring tab.
The Monitoring tab displays two graphs, one showing errors and the other showing rate limited invocations.
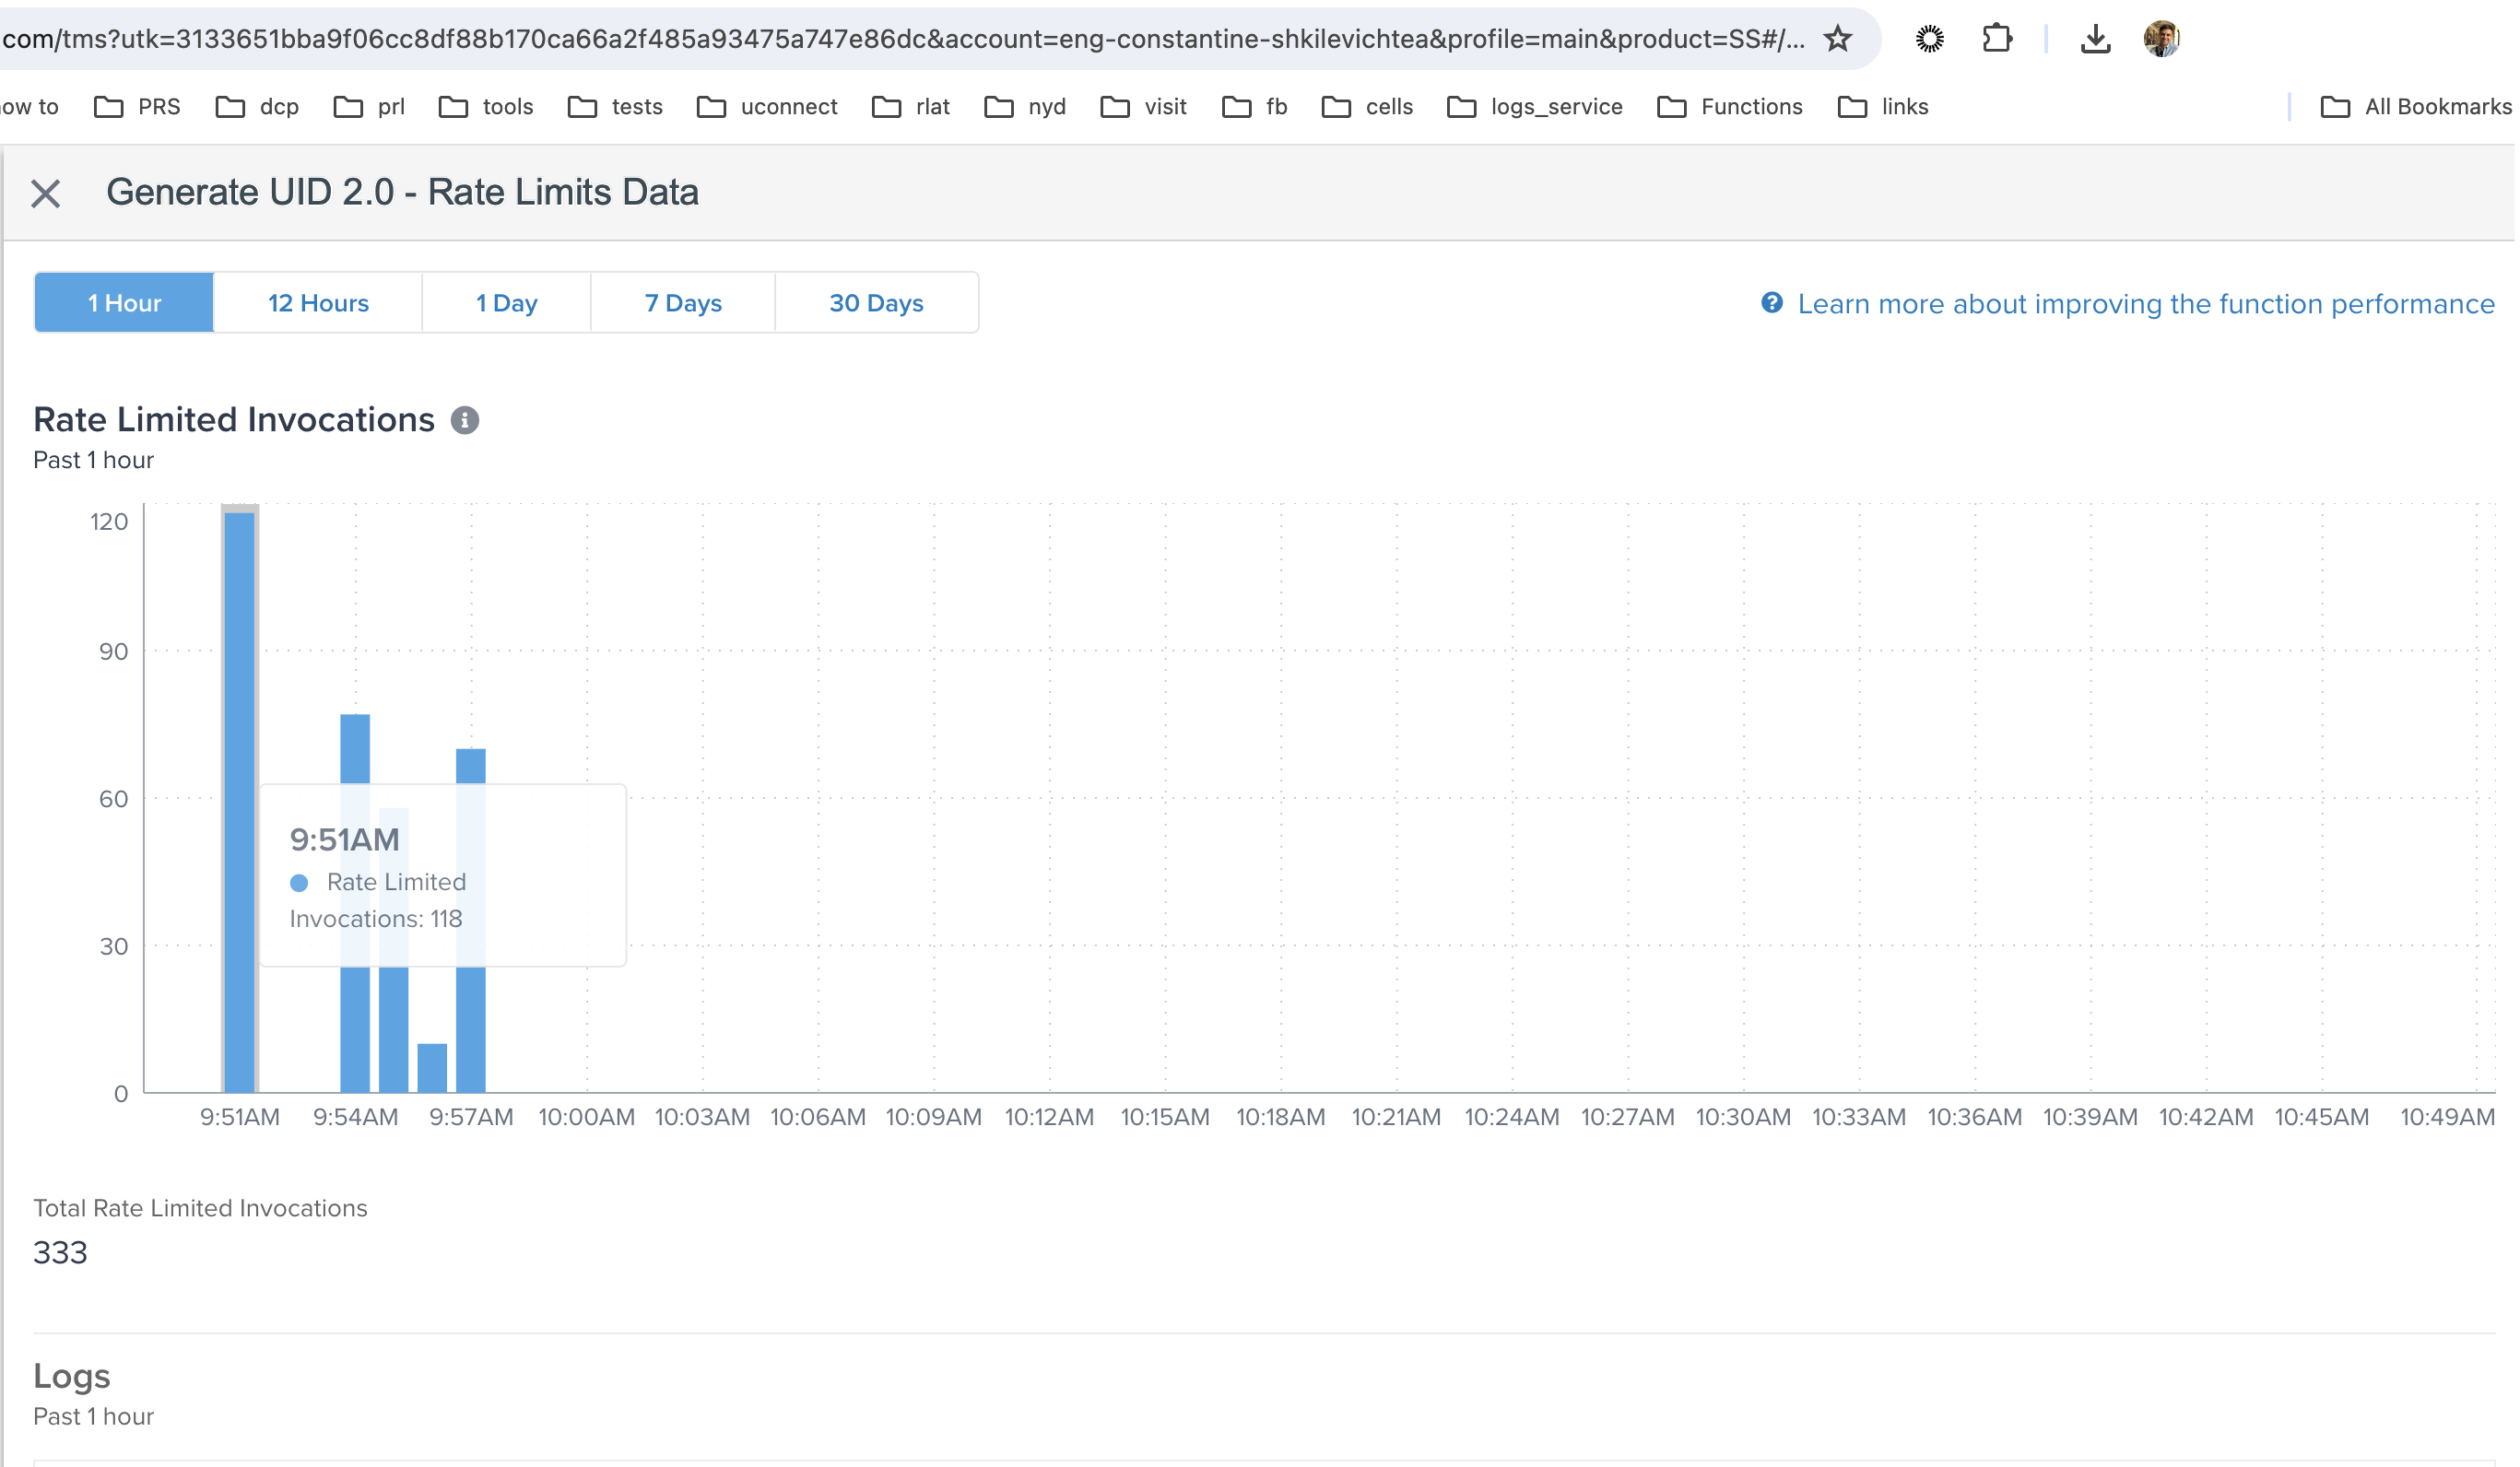
- To view more detailed rate limits information click View Rate Limits Data.

- To adjust the time frame shown in the graph, select the number of hours or days to include in the graph.
- To view details for a log, click on a log file.
The expanded view of the log shows the following information:- The type of limit that was exceeded.
- The time throttling started and ended.
- The number of dropped messages (the number of function invocations that were dropped).
View function statistics
After you have set the status of a function to On, you can view graphs of the following function execution statistics:
- Invocations
- Execution Time
- Errors
Graphs can be displayed for the following time frames:
- Last hour
- Last 12 hours
- Last day
- Last 7 days
- Last 30 days
Follow these steps to view function statistics:
- Navigate to Functions > Overview, and click a function in the list.
- Click the Monitoring tab to see the graphs of the function statistics.
This page was last updated: September 13, 2024