Data Connect dashboard
This article describes the Data Connect dashboard.
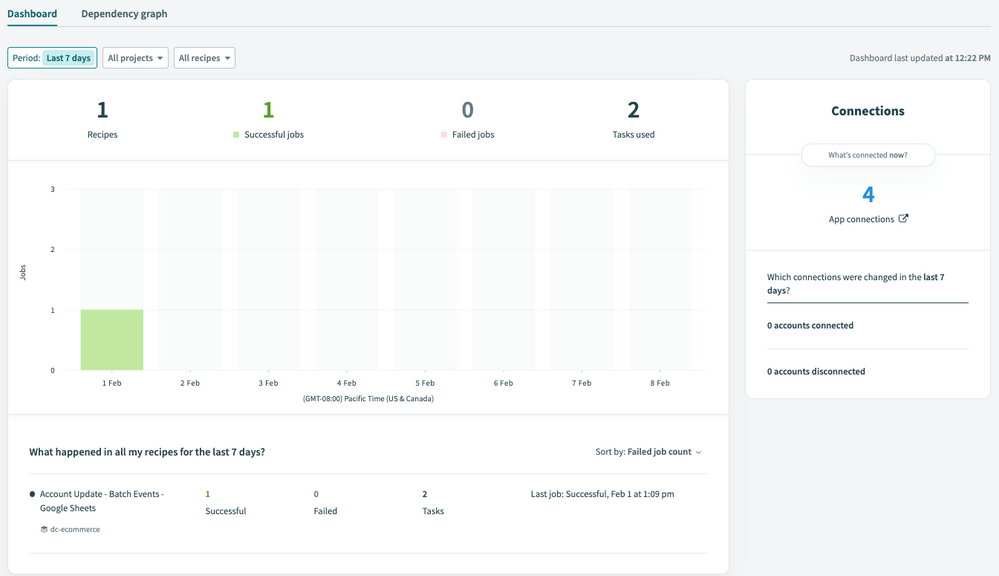
The Data Connect dashboard displays statistics about recipes, jobs, tasks, and connections. The Dependencies graph tab shows graphs of links between Apps, Connections, and Recipes.

Dashboard tab
You can view statistics for a preset time range or enter a custom time range. To set a custom time range, select Custom range to choose a start and end date from a calendar.
The statistics are shown for all projects and all recipes by default.
- To view statistics for active recipes, click All recipes, then click Active.
- To view statistics for recipes with errors, click All recipes, then click With errors.
View statistics for a project
Statistics are shown for all projects by default.
To view statistics for a specific project:
- Click All projects.
- In the search box, type all or part of the project name.
- Select a project from the list of matching projects.
Dependencies graph tab
The Dependencies graph shows the relationships of connections and recipes for an app integration. By default, the graph shows all apps and all recipe statuses. App names identify the connections being made, such as Salesforce, Google Sheets, or Tealium.
- To display a graph for a specific app, click All apps and select an app. To see details about a node in the graph, click that node. Click Back to return to the previous graph.
- To display a graph for inactive recipes, click All recipe statuses, then click Inactive.
- To display a graph for active recipes, click All recipe statuses, then click Active.
- To revert to All recipe statuses, click the X for the current status.
This page was last updated: July 21, 2023