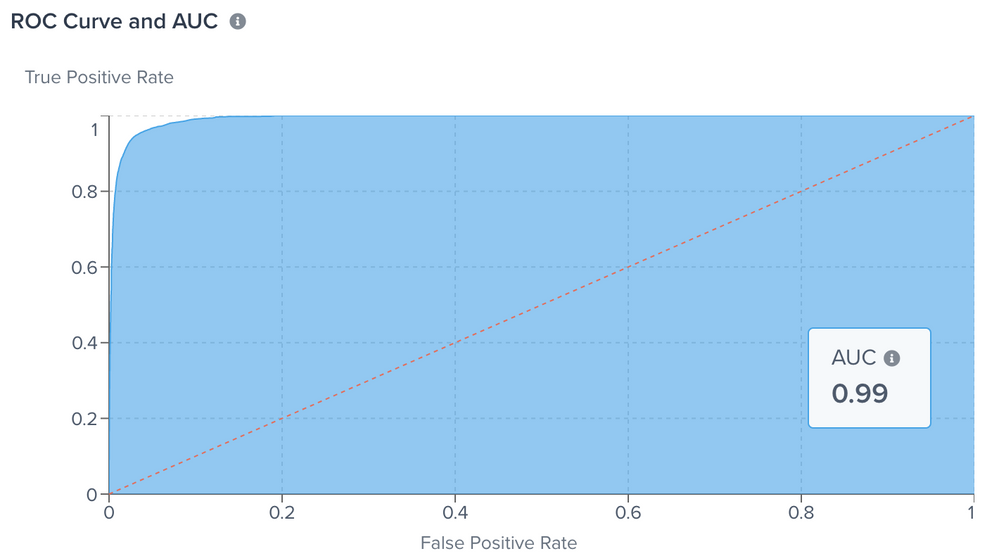
The ROC/AUC curve
This article describes the ROC/AUC curve and how to use it as a performance measurement of a trained model.
In Tealium Predict, the ROC/AUC (under the curve) is a performance measurement reported for a trained model in the Model Explorer. In industry terms, the ROC is a true positive rate calculated as the number of true positives divided by the sum of the number of true positives and the number of false negatives. The ROC describes how well a model predicts the positive class when the actual outcome is positive. The true positive rate is also referred to as Sensitivity. Access the ROC/AUC Curve for your trained model by navigating to the Model Dashboard > View Model Details > Training > View Training Details.

The Receiver Operating Characteristics (ROC) curve and the area under this curve (referred to as AUC, for area under curve) are common tools in the machine learning community for evaluating the performance of a classification model.
The ROC curve shows the trade-offs between different thresholds and consists of a plot of True Positive Rate (y-axis) against the False Positive Rate (x-axis), as follows:
- True Positive Rate = Sensitivity
- False Positive Rate = (1 - Specificity)
Ideally, the results allow you to distinguish between true and false classes. The model always predicts the correct answer.
ROC examples
The following example depicts a “perfect model” for Probability Distribution and the ROC curve:
- For the above ROC curve, AUC = 1. The entire graph area displays underneath and to the right of the red curve (boundary).
For an extreme contrast, the following example depicts the Probability Distribution and ROC curve in scenarios where your model always predicts the wrong answer, for example always labeling true as false, and vice versa.
- For this ROC curve, AUC = 0.
The following example depicts a poor scenario, which is defined as a model that is incapable of distinguishing between true and false classes. In this scenario, the Probability Distribution displays two large curves directly on top of each other.
- The ROC curve is a diagonal line; and AUC = 0.5.
In a realistic ROC curve, 0.5 < AUC < 1.0 displays smaller values on the x-axis of the plot to indicate lower false positives and higher true negatives. Larger values display on the y-axis of the plot to indicate higher true positives and lower false negatives.
When predicting a binary outcome, it is either a correct prediction (true positive) or not (false positive).
This page was last updated: January 22, 2025