The Confusion Matrix
This article describes the Confusion Matrix and how to use it to evaluate a trained model.
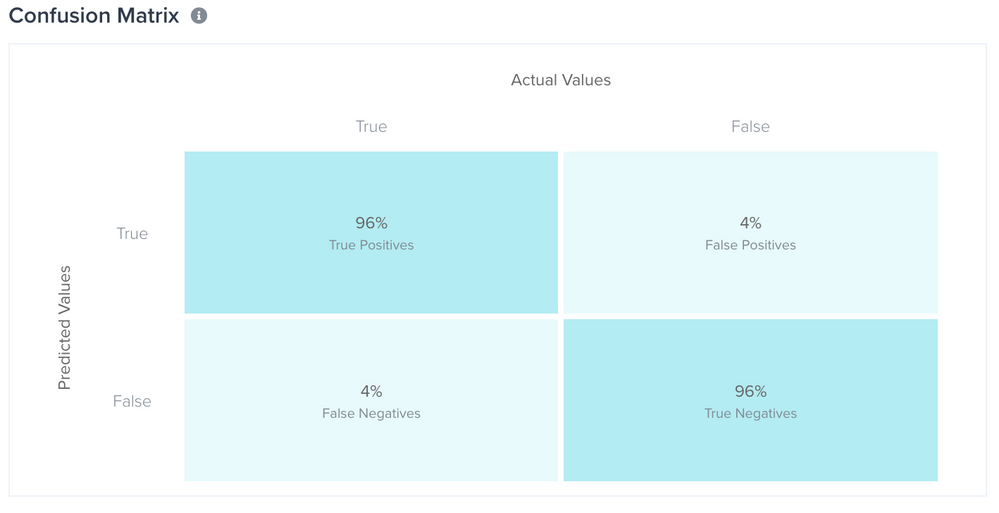
A Confusion Matrix is a key tool used to evaluate a trained model. During the training and testing process that runs automatically when you create or retrain a model, Tealium Predict attempts to “classify” the visitors during the Training Date Range into two groups: true and false. These two groups reflect whether a user actually did the behavior signalled by the Target Attribute of your model, such as made a purchase or signed up for your email list.
Access the Confusion Matrix for your trained model by navigating to the Model Dashboard > View Model Details > Training > View Training Details. The Confusion Matrix lets you easily view the accuracy of these predictions by comparing the true or false prediction value with the true or false actual value. There are four possible scenarios, as described quadrants description below.

This comparison is made possible by the fact that the model trains on historical data (the Training Date Range). Once your model is deployed, the scenario changes. If your deployed model makes a prediction for a particular visitor today and the prediction timeframe is “in the next 10 days”, results are not available for up to 10 days to determine whether the value returns as true or false.
Quadrants of the Confusion Matrix
The following list describes the four quadrants of the Confusion Matrix:
- True Positive
Correctly predicted true (predicted true and was actually true) - True Negative
Correctly predicted false (predicted false and was actually false) - False Positive
Incorrectly predicted true (predicted true but was actually false) - False Negative
Incorrectly predicted false (predicted false but was actually true)
You can use the values of the quadrants to calculate the two constituent parts of F1 Score (Recall and Precision).
The following list describes how the values are calculated:
- Accuracy = (TP + TN) / (TP + FP + FN + TN)
The accuracy is the number of correct predictions divided by the total number of predictions made. - Precision
Shows the proportion of all positive predictions that were positive. - Recall
Shows the proportion of positive predictions that were correct.
The Confusion Matrix uses a threshold value of 0.5 to differentiate between predicted positive and predicted negative values.
This page was last updated: June 25, 2025