Probability distribution
This article describes how to use the probability distribution to interpret trained models.
The Training Details screen for any version of any trained model shows a probability distribution of the predictions made by the model during training.

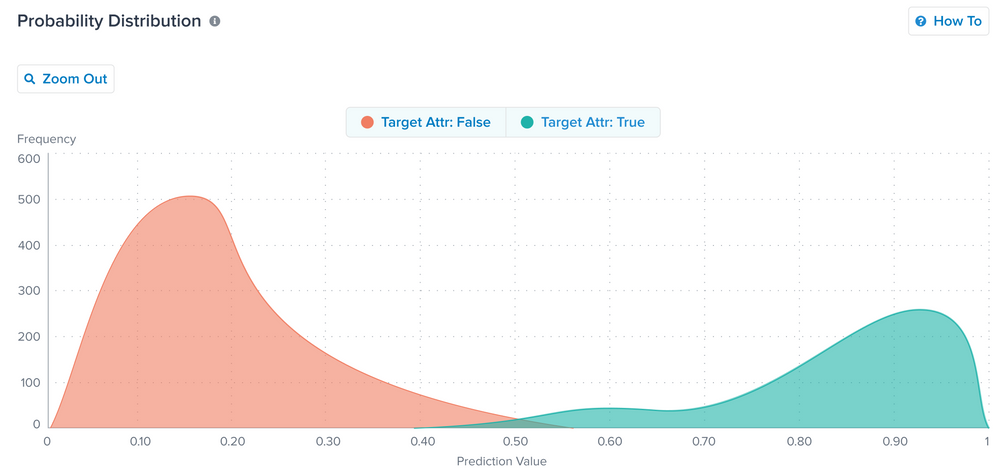
The two colored curves of this chart represent the distributions of true and false predictions that the model made during training. Since the model training process uses historical data and you know whether each visitor actually performed the target behavior, it is possible to test the model by comparing the predictions for historical visitors versus the actual outcomes. The purpose of this comparison is to set aside a portion of the training dataset as the test subset.
The probability distribution compares predictions against actual values for the visitors in the test subset. Visitors who were part of the True class (did perform the behavior) are displayed as part of the teal-colored curve and visitors who were part of the False class are part of the orange-colored curve.
Ideal probability distribution
The following list describes characteristics of an ideal probability distribution:
- There is clear separation between the True and False classes, as depicted by the teal and orange curves. This shows the model can easily and accurately classify visitors.
- Each class (curve) only covers one portion of the predicted value range. The False class ideally focuses on the lower range on the left and the True class focuses on the upper range on the right.
This page was last updated: February 21, 2023