About connectors
This article describes how to add and configure connectors for Tealium EventStream API Hub and Tealium AudienceStream CDP.
The new connectors interface is in Early Access and is only available to select customers. If you are interested in trying this feature, contact your Tealium Support representative.
How it works
A connector is an integration that transmits data between Tealium and another vendor in real-time. A connector offers actions that represent vendor-supported APIs. An action is triggered in real-time by an incoming event from a feed or a visitor joining or leaving an audience. An action sends data based on mappings that associate Tealium attributes to the expected vendor parameters.
Terminology
- Connector
A connector represents the connection to your vendor account. This is configured using credentials such as an account ID, username and password, or an API key. - Action
An action is a vendor operation, such as triggering an email, building a custom audience, or managing leads. Actions vary depending on the vendor service. Multiple actions can be associated with a single connector. - Frequency Cap
A connector action performs in real-time, but some actions are designed to have a wait period before they are triggered. The frequency cap allows you to set a downtime period for actions so that they do not trigger immediately. Learn more about Frequency Capping and Prioritization. - Source
Source indicates the origin of the data being acted upon. A source can be an audience or an event feed.
Consent categories
Each connector in the marketplace has one or more consent categories assigned for each available action. The consent information for a connector action is shown on the Action Details screen, under Additional Details.

AudienceStream is categorized in the CDP consent category and DataAccess is categorized in the Big Data consent category. For additional information about server-side consent, see Consent Preferences Manager.
Retries
If a connector action fails, it is retried three times at 1-minute, 5-minute, and 30-minute intervals. If the request is successful on any of the subsequent retry attempts, the request is reported as a success in the UI. If all three retries fail, the request is dropped and reported as an error in the UI.
A retry is attempted when any of the following error codes occur:
- 408 – Forbidden
- 429 – Too Many Requests
- 500 – Internal Server Error
- 502 – Bad Gateway
- 503 – Service Unavailable
- 504 – Gateway Timeout
A retry is not attempted when a Response Timeout - Vendor API did not respond within 5000 milliseconds response is received. The request payload was sent, but the vendor did not send a response within our allowed time of five seconds. The request may have succeeded on the vendor’s side, but because it took longer than five seconds to get a response, we treat it as a failure.
Overload protection
Connectors perform actions through multiple instances of a data handler. Sometimes, data handlers encounter transmission errors with vendors. If errors exceed a configured threshold, Tealium can pause or throttle data transmission to vendors until the error rate drops.
For example, if the overall rate of failure for an instance exceeds 40% per 100 attempts, that instance pauses processing actions for 1 minute. The instance then attempts to process half of the actions in the queue. If the failure rate for these 50 attempts remains above 20%, the instance pauses for another 60 seconds before trying again. Otherwise, the instance resumes full operation.
Tealium activates and adjusts the thresholds at the various levels as needed to ensure maximum success and performance for customers.
Restricted data
Restricted data settings do not apply to connectors. Attributes marked as restricted data are always included, whether you are sending them through mappings or as part of the visitor profile. This cannot be changed. Learn more about Restricted Data.
IP allow lists
If a connector you use has strict rules about which systems it accepts requests from, you can add the IP addresses of the Customer Data Hub to your allow list. The IP addresses that make connector requests can be found in the IP Addresses for Customer Data Hub.
Screen navigation
Connectors Overview screen
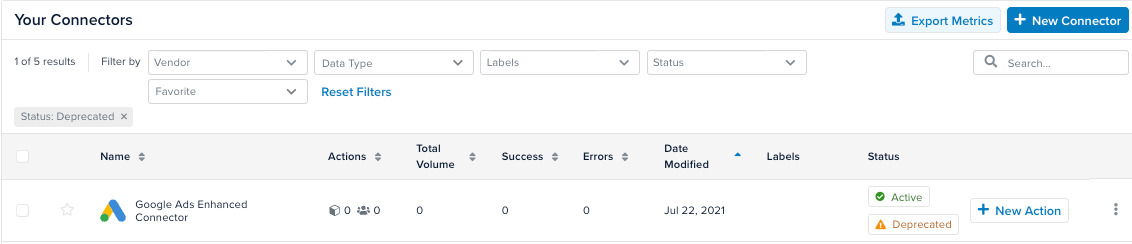
The Connectors Overview screen displays the following data about each connector:
- Actions
The number of connector actions configured for EventStream and AudienceStream. Click the Information (i) icon to display the timeline for the total in this column. - Total Volume The number of actions triggered for the connector.
- Success
The number of action successes. - Error
The number of action errors. - Date Modified
The date the connector was last modified. - Labels
The labels applied to the connector. - Status
The connector status, which can be Active, Inactive, or Deprecated.
You can export metrics (total volume, successes, errors, and retries) for all connectors by clicking Export Metrics.
Expand the connector menu for a connector to access the Edit Labels, Duplicate, and Delete features, as shown in the following figure:
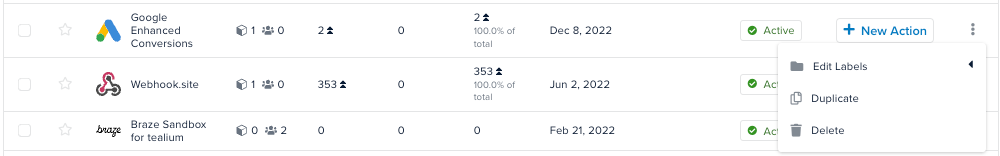
For more information, see Add a connector.
Deprecated connectors and actions
Connectors and actions can be deprecated, which means they may be unsupported or removed in the future. Deprecation typically occurs when a connector or an action has been replaced with a newer version or a new connector or action that should be used instead.
There are two types of deprecation, as follows:
- Functional Deprecation – The connector or action is deprecated, and may be removed in the future, but is still working.
- Full Deprecation – The connector or action is deprecated and no longer works. Actions for a fully deprecated connector are not executed.
Connector Details screen
When you click on a connector action, the Connector Details screen is displayed. The Overview tab is displayed by default and shows information about action trends, including successful actions, actions with errors, and a graph of the delivery status.
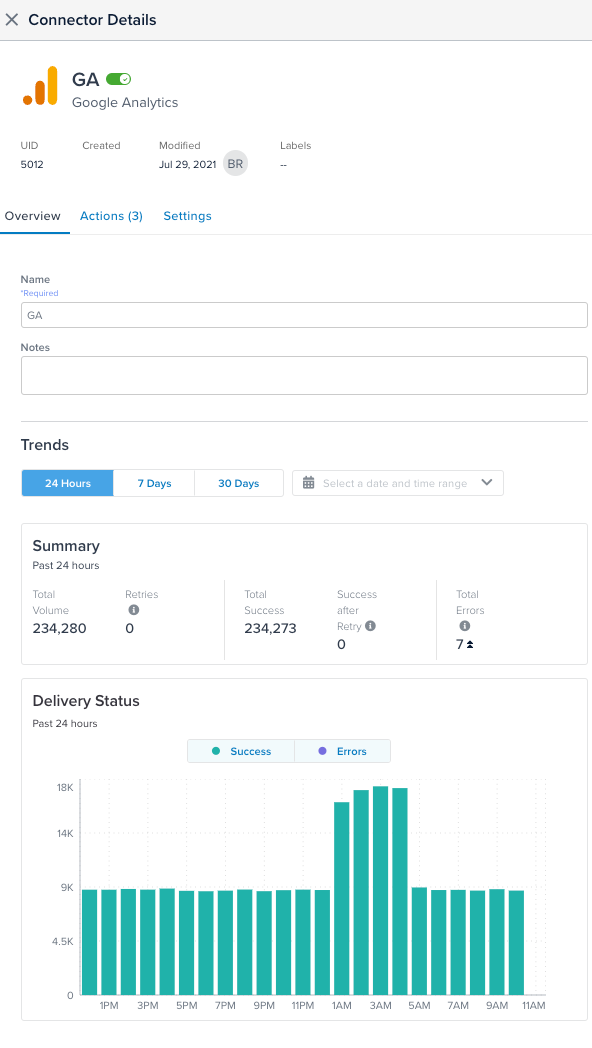
You can view the trends data for the Past 24 hours, Past 7 days, or Past 30 days. The default is the Past 24 hours. Successful actions are shown in green and errors are shown in blue. Click any part of the graph to view a summary of the data for that display.
View sampled errors for an action
Use the following steps to view error information for a connector action:
- Go to Server-Side > Connectors, then select a connector.
- Click the Actions tab, then select an action that has errors.
The Action Details screen is displayed. - Under Trends, select 24 Hours, 7 Days, or 30 Days.
- Below the graph, a list of error messages is shown. Each entry in the list displays the error category, the message, the number of errors included in the report, and the total number of occurrences of the error.
- To view the details for an error, click the list entry.
The detailed view includes a sample of the affected code with a timestamp containing the day of the week, the date, and the time.
Export sampled errors
Use the following steps to export sampled errors for a connector:
- Go to Server-Side > Connectors, then select a connector.
- Click the Actions tab, then select an action that has errors.
The Action Details screen is displayed. - Click Export Sampled Errors.
The errors are exported to a CSV file that is saved to your default download location. - Open the CSV file to examine the details or share the file with others for further collaboration.
This page was last updated: February 27, 2025